
VCF Extension Network Insight: Overview
Version: 2026.1.1.0
This Management Pack monitors the NSX policy that the VCF Extension Network Insight GUI builds for an application. Everything below appears in Aria Operations once a policy has been applied.
Dashboards
NSX DFW Monitoring
The NSX DFW Monitoring dashboard provides the operational view of distributed firewall behaviour:
- NSX Policies List: heatmap of DFW Security Policies colored and sized by the health badge.
- Dropped Objects: resource list of DFW Endpoint objects that have seen dropped traffic.
- Object Relationship: a relationship widget showing the policy, rule and endpoint topology.
- Alert List: active alerts scoped to the NSX Application custom group.
Widgets are linked: selecting a policy drives the Dropped Objects and Object Relationship widgets.
Custom Groups
| Custom Group Name | Description |
|---|---|
| NSX Application | A group that auto-aggregates Security Policies, Firewall Rules and DFW Endpoints into one business application view. |
Collected objects
Relationships
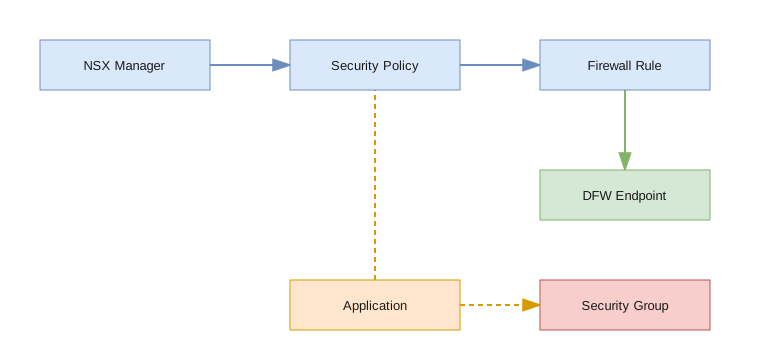
A rule parents the endpoints it actually dropped traffic for, not the groups referenced in its definition. Group membership answers "who is this rule written against"; the product answers "who is this rule blocking", a fact observed from log lines rather than configuration.
NSX Manager
Adapter instance root. Carries collection telemetry and the durable state checkpoint.
| Data Name | Type | Description |
|---|---|---|
collection|policies | metric | Number of policies collected this cycle. |
collection|rules | metric | Number of rules collected this cycle. |
collection|groups | metric | Number of groups collected this cycle. |
collection|endpoints | metric | Number of endpoints emitted this cycle. |
collection|duration | metric | Collection duration in seconds. |
collection|nsx_api_calls | metric | Number of NSX API calls made this cycle. |
logs|lines | metric | Log lines returned this cycle. |
logs|lines_parsed | metric | Log lines successfully parsed. |
nsx_version | property | NSX version. |
logs_available | property | Whether the Aria Operations for Logs source is available. |
logs_host | property | Configured / active log source host. |
Security Policy
One NSX security policy (DFW Policy). Parents its rules.
| Data Name | Type | Description |
|---|---|---|
drops|tuples | metric | Total traffic tuples this policy has dropped. |
drops|tuples_new | metric | Newly seen dropped tuples. |
quality|rules_total | metric | Total number of rules in the policy. |
quality|rules_drop | metric | Number of rules in the policy in DROP mode. |
category | property | Policy category. |
application | property | Application the policy belongs to. |
managed_by | property | Automation/adapter that manages the policy. |
Firewall Rule
One NSX firewall rule (DFW Rule). The primary carrier of traffic and drop metrics.
| Data Name | Type | Description |
|---|---|---|
traffic|packets | metric | Cumulative traffic packet count. |
traffic|sessions | metric | Cumulative traffic session count. |
traffic|hits | metric | Cumulative rule hit count. |
traffic|packets_delta | metric | Packets in this cycle. |
traffic|bytes_delta | metric | Bytes in this cycle. |
traffic|sessions_delta | metric | Sessions in this cycle. |
drops|tuples | metric | Dropped flow tuples. |
drops|tuples_new | metric | New dropped flow tuples (drives the new-dropped-traffic-on-rule alert). |
drops|lines | metric | DFW log lines matched for this rule. |
age|minutes_since_last_hit | metric | Minutes since the rule last hit. |
action | property | Rule action (ALLOW/DROP). |
logged | property | Whether the rule is configured to log. |
internal_rule_id | property | Number a log line carries to attribute a tuple to this rule. |
is_witness | property | Whether the rule is one of the catch-all rules at the end of the policy. |
sequence_number | property | Rule sequence number. |
application / managed_by | property | Owning application and managing automation. |
last_dropped | property | Last dropped-flow indication. |
Security Group
One NSX security group with its effective membership.
| Data Name | Type | Description |
|---|---|---|
application | property | Application the group belongs to. |
managed_by | property | Managing automation. |
membership_criteria | property | Effective membership criteria. |
Application
A business rollup built from the application tag on the machines. Does not exist in NSX; it is created by the solution to give one view per application.
| Data Name | Type | Description |
|---|---|---|
drops|tuples_total | metric | Total tuples dropped across the application. |
drops|tuples_new_24h | metric | New dropped tuples within the last 24 hours ("What Just Broke"). |
drops|endpoints_affected | metric | Number of endpoints affected by dropped traffic. |
quality|rules_total | metric | Total number of rules in the application. |
enforcement_state | property | observation, partial or enforced. |
DFW Endpoint
One address (or aggregate bucket) seen in dropped or observed traffic.
| Data Name | Type | Description |
|---|---|---|
drops|tuples_new | metric | New dropped flow tuples. |
ip_address | property | The address observed in traffic. |
vm_name / fqdn | property | Resolved machine name / FQDN, where the vSphere join map or reverse DNS allows. |
application | property | Application the endpoint is attributed to. |
classification | property | Sortable classification of the endpoint. |
first_seen / last_seen | property | First / last observed timestamp. |
services | property | Protocol/port pairs seen, e.g. tcp/9090, tcp/443. |
peers | property | Peer addresses it communicated with. |
| rule relationship | relation | The rule that dropped traffic to/from this endpoint. |
Alerts
| Alert | Severity | Threshold |
|---|---|---|
| New dropped traffic on policy | Critical | New dropped traffic seen on a Security Policy. |
| New dropped traffic on rule | Critical | New dropped traffic seen on a Firewall Rule. |
| License is expiring soon | Warning | expiration_date ≤ 15 and > 0. |
| License has expired | Critical | expiration_date ≤ 0. |
Events
Events are raised when a new dropped-traffic connection appears on a rule after the learning period. During the learning window (default 24h) traffic is recorded and counted but no new-traffic event is raised, so the initial baseline does not flood the operator with events.
Metric groups
The collected metrics are organised into the following groups:
| Group | Description |
|---|---|
collection | Manager-level collection telemetry group. |
logs | Manager-level log processing telemetry group. |
drops | Drop metrics group (tuples, new tuples, endpoints affected). |
traffic | Traffic counter group (packets, sessions, hits, deltas). |
quality | Rule-quality (enforcement readiness) metric group. |
age | Age metric group (e.g. minutes_since_last_hit). |