
VCF Extension Network Insight: Introduction
Version: 2026.1.1.1
What it is
VCF Extension Network Insight is a complete microsegmentation solution for VMware NSX. It has two parts that work as one product: a browser tool, VCF Extension Network Insight GUI, that builds the NSX Distributed Firewall (DFW) policy for an application, and a VMware Aria Operations Management Pack that then monitors that policy and tells who each rule affects.
The GUI reads the tags set on the machines in vCenter and the real traffic seen in Aria Operations for Networks, and turns them into NSX groups, services, policies and ALLOW rules. It always shows a plan before it writes anything, and it never creates blocking rules. The Management Pack watches the result in Aria Operations: it attributes every dropped and observed connection to the rule that produced it, so it can be seen when it is safe to move from observing to enforcing.
How does it work?
- Tagging: each machine in vCenter is tagged with its application and its tier.
- Discovery: the GUI reads the machines, tags and addresses from vCenter, and the real flows between them from Aria Operations for Networks.
- Planning: it proposes the NSX groups, services and ALLOW rules for the application, and shows them as a plan before writing.
- Apply: after the plan is reviewed, the policy, groups and rules are written to NSX, plus three catch-all rules that allow and log whatever the detailed rules did not match.
- Monitoring: the Management Pack reads the DFW logs through Aria Operations for Logs and attributes every dropped and observed connection to the rule that produced it.
- Readiness: while the catch-all counters keep rising there is still traffic no rule describes; when they stop, the application is ready to switch to blocking.
Benefits
- One workflow from tagging to enforcement: build the policy and watch it from the same solution.
- Based on real traffic, not guesswork: rules come from observed flows, and the GUI answers who a rule blocks from the logs, not from configuration.
- Safe by design: it only ever creates ALLOW rules and always shows a plan first, so nothing is blocked by surprise.
- Centralized visibility in Aria Operations: DFW rules, policies and applications monitored through a single adapter instance, with alerts on newly blocked traffic.
- Clear readiness signal: the catch-all counters show, per application, when it is safe to move from observing to enforcing.
VCF Extension Network Insight: Overview
Version: 2026.1.1.1
This Management Pack monitors the NSX policy that the VCF Extension Network Insight GUI builds for an application. Everything below appears in Aria Operations once a policy has been applied.
Dashboards
NSX DFW Monitoring
The NSX DFW Monitoring dashboard provides the operational view of distributed firewall behaviour:
- NSX Policies List: heatmap of DFW Security Policies colored and sized by the health badge.
- Dropped Objects: resource list of DFW Endpoint objects that have seen dropped traffic.
- Object Relationship: a relationship widget showing the policy, rule and endpoint topology.
- Alert List: active alerts scoped to the NSX Application custom group.
Widgets are linked: selecting a policy drives the Dropped Objects and Object Relationship widgets.
Custom Groups
| Custom Group Name | Description |
|---|---|
| NSX Application | A group that auto-aggregates Security Policies, Firewall Rules and DFW Endpoints into one business application view. |
Collected objects
Relationships
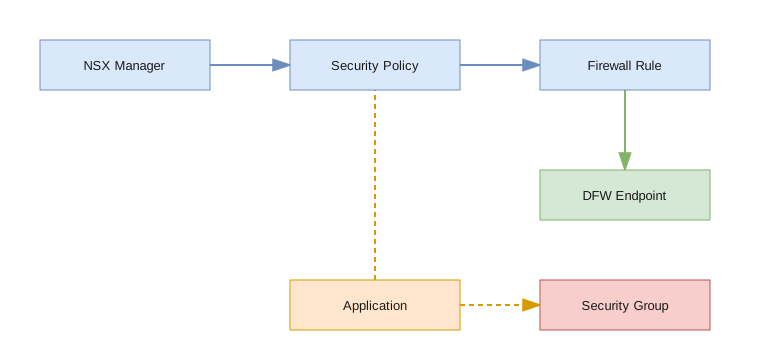
A rule parents the endpoints it actually dropped traffic for, not the groups referenced in its definition. Group membership answers "who is this rule written against"; the product answers "who is this rule blocking", a fact observed from log lines rather than configuration.
NSX Manager
Adapter instance root. Carries collection telemetry and the durable state checkpoint.
| Data Name | Type | Description |
|---|---|---|
collection|policies | metric | Number of policies collected this cycle. |
collection|rules | metric | Number of rules collected this cycle. |
collection|groups | metric | Number of groups collected this cycle. |
collection|endpoints | metric | Number of endpoints emitted this cycle. |
collection|duration | metric | Collection duration in seconds. |
collection|nsx_api_calls | metric | Number of NSX API calls made this cycle. |
logs|lines | metric | Log lines returned this cycle. |
logs|lines_parsed | metric | Log lines successfully parsed. |
nsx_version | property | NSX version. |
logs_available | property | Whether the Aria Operations for Logs source is available. |
logs_host | property | Configured / active log source host. |
Security Policy
One NSX security policy (DFW Policy). Parents its rules.
| Data Name | Type | Description |
|---|---|---|
drops|tuples | metric | Total traffic tuples this policy has dropped. |
drops|tuples_new | metric | Newly seen dropped tuples. |
quality|rules_total | metric | Total number of rules in the policy. |
quality|rules_drop | metric | Number of rules in the policy in DROP mode. |
category | property | Policy category. |
application | property | Application the policy belongs to. |
managed_by | property | Automation/adapter that manages the policy. |
Firewall Rule
One NSX firewall rule (DFW Rule). The primary carrier of traffic and drop metrics.
| Data Name | Type | Description |
|---|---|---|
traffic|packets | metric | Cumulative traffic packet count. |
traffic|sessions | metric | Cumulative traffic session count. |
traffic|hits | metric | Cumulative rule hit count. |
traffic|packets_delta | metric | Packets in this cycle. |
traffic|bytes_delta | metric | Bytes in this cycle. |
traffic|sessions_delta | metric | Sessions in this cycle. |
drops|tuples | metric | Dropped flow tuples. |
drops|tuples_new | metric | New dropped flow tuples (drives the new-dropped-traffic-on-rule alert). |
drops|lines | metric | DFW log lines matched for this rule. |
age|minutes_since_last_hit | metric | Minutes since the rule last hit. |
action | property | Rule action (ALLOW/DROP). |
logged | property | Whether the rule is configured to log. |
direction | property | Rule direction (IN/OUT/IN_OUT). |
internal_rule_id | property | Number a log line carries to attribute a tuple to this rule. |
is_witness | property | Whether the rule is one of the catch-all rules at the end of the policy. |
disabled | property | Whether the rule is disabled in NSX. |
sequence_number | property | Rule sequence number. |
application / managed_by | property | Owning application and managing automation. |
last_dropped | property | Last dropped-flow indication. |
Security Group
One NSX security group with its effective membership.
| Data Name | Type | Description |
|---|---|---|
application | property | Application the group belongs to. |
managed_by | property | Managing automation. |
membership_criteria | property | Effective membership criteria. |
Application
A business rollup built from the application tag on the machines. Does not exist in NSX; it is created by the solution to give one view per application.
| Data Name | Type | Description |
|---|---|---|
drops|tuples_total | metric | Total tuples dropped across the application. |
drops|tuples_new_24h | metric | New dropped tuples within the last 24 hours ("What Just Broke"). |
drops|endpoints_affected | metric | Number of endpoints affected by dropped traffic. |
quality|rules_total | metric | Total number of rules in the application. |
enforcement_state | property | observation, partial or enforced. |
DFW Endpoint
One address (or aggregate bucket) seen in dropped or observed traffic.
| Data Name | Type | Description |
|---|---|---|
drops|tuples_new | metric | New dropped flow tuples. |
ip_address | property | The address observed in traffic. |
vm_name / fqdn | property | Resolved machine name / FQDN, where the vSphere join map or reverse DNS allows. |
application | property | Application the endpoint is attributed to. |
classification | property | Sortable classification of the endpoint. |
first_seen / last_seen | property | First / last observed timestamp. |
services | property | Protocol/port pairs seen, e.g. tcp/9090, tcp/443. |
peers | property | Peer addresses it communicated with. |
| rule relationship | relation | The rule that dropped traffic to/from this endpoint. |
Alerts
| Alert | Severity | Threshold |
|---|---|---|
| New dropped traffic on policy | Critical | New dropped traffic seen on a Security Policy. |
| New dropped traffic on rule | Critical | New dropped traffic seen on a Firewall Rule. |
| License is expiring soon | Warning | expiration_date ≤ 15 and > 0. |
| License has expired | Critical | expiration_date ≤ 0. |
New dropped traffic
The two "New dropped traffic" alerts above are driven by the drops|tuples_new metric on the Firewall Rule and the Security Policy; the adapter does not raise a separate per-tuple event. The optional learning period (Learning period (minutes), default 0 = off) suppresses new-tuple alerts for a configured number of minutes after installation, so an initial baseline does not flood the operator. With the default of 0, alerts fire from the first collection.
Metric groups
The collected metrics are organised into the following groups:
| Group | Description |
|---|---|
collection | Manager-level collection telemetry group. |
logs | Manager-level log processing telemetry group. |
drops | Drop metrics group (tuples, new tuples, endpoints affected). |
traffic | Traffic counter group (packets, sessions, hits, deltas). |
quality | Rule-quality (enforcement readiness) metric group. |
age | Age metric group (e.g. minutes_since_last_hit). |
VCF Extension Network Insight: Deployment
Version: 2026.1.1.1
This page covers installing the Management Pack, the monitoring half of the solution. The VCF Extension Network Insight GUI that builds the NSX policy is deployed separately and is described in Deploying the GUI and Using the GUI.
Prerequisites
- VMware Aria Operations 8.10.0 or newer, with a Cloud Proxy (collector group) that can reach the NSX Manager and Aria Operations for Logs.
- Access to the container registry to pre-pull the adapter image on the Cloud Proxy.
- The credentials and connection details listed below.
User Permissions and Connection Requirements
| Category | Description |
|---|---|
| NSX Manager | Reachable over HTTPS/443. A local NSX account with read access to the NSX Policy API (domains, policies, rules, groups, statistics). |
| Aria Operations for Logs | Reachable over HTTPS on port 9543 (the only port the query API answers on). A local account with permission to browse logs. Required for dropped-traffic detection. |
| Container registry | HTTPS/443 to https://registry.indevops.com (always) to pre-pull the adapter image. |
Installing the addon
- Pre-pull the adapter image on the cloud proxies belonging to the collector group, using the image name shown on the release page for the matching version.
- Install the PAK: in VMware Aria Operations go to
Data Sources > Integrations > Repository > Add, upload the PAK and tick both Install the PAK file even if it is already installed and Ignore the PAK file signature checking. - Configure the adapter account: add an adapter instance and supply the credentials and instance parameters below.
Adapter fields
Credentials: one credential type (NSX + Aria Operations for Logs) with four fields:
| Field Name | Definition |
|---|---|
| NSX user | NSX Manager account. |
| NSX password | NSX Manager password. |
| Aria Operations for Logs user | Logs account. |
| Aria Operations for Logs password | Logs password. |
Instance parameters:
| Field Name | Default | Definition |
|---|---|---|
| NSX Manager address | required | Address or FQDN of the NSX Manager, reachable from the Cloud Proxy on port 443. |
| Aria Operations for Logs address | none | Address or FQDN of Aria Operations for Logs. Without it the adapter still collects inventory and counters, but cannot detect dropped traffic. |
| Aria Operations for Logs port | 9543 | The only port the query API answers on. |
| NSX domains | empty | Comma separated list of policy domains to collect; empty means every domain. |
| Accept self-signed certificates | 0 | 1 accepts any certificate presented by NSX and by Aria Operations for Logs. |
| Log window (minutes) | 5 | How far back log lines are queried; must cover the collection interval, or drops fall between two cycles. |
| Log query limit | 20000 | Maximum lines per query. Hitting it exactly means the answer was truncated. |
| Learning period (minutes) | 0 | After installation, tuples are recorded and counted but no new-tuple alert is raised for this many minutes. The default 0 means learning is off and alerts fire from the first collection. |
| Maximum tuples remembered per rule | 500 | Cap on the durable tuple set of one rule; the least recently seen are discarded first. |
| Tuple retention (days) | 90 | How long an unseen tuple is remembered; must outlive a monthly batch. |
| Maximum endpoint objects | 5000 | Cap on DFW Endpoint objects per cycle; above it the quietest addresses fold into their aggregate bucket. |
| Endpoint retention (days) | 30 | How long an unseen address is remembered before it stops being reported. |
| Endpoint visibility (minutes) | 30 | How long a DFW Endpoint object and its rule relationship stay visible after the address goes quiet; the default removes quiet endpoints within ~30 minutes of the address leaving the log window. |
| Rule id map refresh (minutes) | 360 | How often the internal rule id map is rebuilt in full. |
| Rule id map calls per cycle | 500 | Budget of per-rule statistics calls used to build the id map incrementally. |
| VM cache refresh (minutes) | 60 | How often the vSphere join map is refreshed from the Aria Operations Suite API. |
| Witness rule pattern | default | Regular expression marking the catch-all (witness) rules at the end of an application policy, combined with a sequence number of at least 900. Leave the default unless your rules are named differently. |
| Reverse DNS resolution | 0 | 1 enables PTR lookups as the last step of address resolution. |
VCF Extension Network Insight: Using the GUI
Version: 2026.1.1.1
The VCF Extension Network Insight GUI is used entirely from the browser. It always shows a plan before it writes anything to NSX, and it never creates blocking rules. This section walks through a rollout from an empty environment to a finished policy that the Management Pack then monitors.
Tagging the machines in vCenter
A rollout starts in vCenter, before the GUI is opened. The GUI does not guess which machine belongs to which application; it reads the tags that are set. A machine with no tags is invisible to it, and a machine with incomplete tags is reported, never silently skipped.
Create two tag categories in vCenter (Tags and Custom Attributes > Categories > New), both with Applies to: Virtual Machine and cardinality one tag per object:
| Category | Applies to | Cardinality | Example values | Purpose |
|---|---|---|---|---|
| application | Virtual Machine | one tag per object | CRM, BILLING, ERP | the application the machine belongs to. Short, uppercase, no spaces |
| tier | Virtual Machine | one tag per object | WEB, APP, DB, INT | the role the machine plays inside the application |
Cardinality has to be single: with multiple tags a machine can belong to two applications and ends up on hold instead of being segmented. Cardinality cannot be changed after the category is created, so getting it right now saves recreating the category later. The category names are a setting, so the names already used in the organisation can be entered on the Settings tab.
The application tag value becomes part of every object name in NSX, so keep it short, uppercase, without spaces and stable over time. The default set of tiers is:
| Value | Meaning |
|---|---|
WEB | anything that terminates user traffic: reverse proxies, front ends |
APP | application servers, business logic, integration components |
DB | databases and anything that stores the application state |
INT | integration and messaging components, if kept apart |
ACC | access and jump hosts belonging to the application |
INF | infrastructure machines that belong to this application only |
OTR | everything else that belongs to the application but fits nowhere above |
The allowed list of tiers is a setting; keep it short. Every extra tier multiplies the number of rules, because rules are created per pair of tiers.
One machine, one application. If a machine genuinely serves two applications, it is a shared service, not a member of either. Leave it untagged and let it come up as a decision, then point the rule at a group.
Tag a machine with Actions > Tags and Custom Attributes > Assign Tag, or in bulk by selecting several machines in the VMs list. For large environments, PowerCLI is faster:
Get-VM -Name 'swpp-*' | New-TagAssignment -Tag 'SWPP'
Get-VM -Name 'swpp-web*' | New-TagAssignment -Tag 'WEB'
The Applications tab (below) shows what the GUI found and which machines have incomplete tags. Fix what it lists before planning anything: tags are the input, and nothing downstream can be better than they are.
Environment and access
The GUI reaches vCenter, NSX and Aria Operations for Networks on 443 and Aria Operations for Logs on 9543, all outbound; the only inbound connection is the administrator browser on 8443 (443 behind an ingress). The full network access and account table — including the least-privilege roles and the two ports people get wrong — is in Deploying the GUI, under Requirements.
First configuration
After signing in, open the Settings tab:
System addresses. Type the host name or IP only; the GUI adds the scheme and the port itself, including 9543 for Aria Operations for Logs:
vcenter.company.local   ->  https://vcenter.company.local
10.30.11.70             ->  https://10.30.11.70
logs.company.local      ->  https://logs.company.local:9543
Test connections. Every system is checked and reported separately, so a failing account is identified immediately instead of hiding behind one generic error.
Tag taxonomy. Enter the tag category names used in vCenter and the list of allowed tiers. The environment category is off by default: an empty value disables it completely. Turn it on only if somebody really maintains that tag.
Naming convention. Templates for group and rule names, with a live preview (explained below).
Save the settings.
Two things are deliberately not in the interface: rule numbering and the DFW policy category. An administrator has no decision to make about either, and wrong numbering would break the catch-all mechanism silently.
Naming: what the objects are called
Every object the GUI creates in NSX gets its name from a template, and every template is a setting. In the templates below, {ba} is the application tag value (shown here as SWPP), {tier} is the tier tag, and {src}/{dst} are the source and destination tiers. The defaults are:
| Template | Default | Result | What it is |
|---|---|---|---|
| Group name | {ba}-{tier} | SWPP-WEB, SWPP-ALL | one group per tier, plus one for the whole application |
| Rule name | {ba}-{src}-to-{dst} | SWPP-WEB-to-APP | one rule per pair of tiers that actually talk |
| Catch-all rule name | {ba}-ALL-{direction} | SWPP-ALL-ALL, SWPP-ALL-OUT, SWPP-ALL-IN | the three logging rules at the end of the policy |
| Peer group name | {ba}-peer-{peer} | SWPP-peer-mon01 | a group for a machine outside the application that was approved |
| Service name | {prefix}-svc-{proto}-{port} | msg-svc-tcp-8080 | created only when the NSX catalog has no equivalent |
| Identifier prefix | msg | msg-SWPP-WEB | how the GUI recognises its own objects |
The application name has to be in every template, so a rule name reads left to right as a sentence: SWPP-WEB-to-APP is inside application SWPP, from the WEB tier to the APP tier. Without the application name, two applications would produce objects with the same name.
The three catch-all rules are worth knowing by sight:
| Rule | Matches | Why it exists |
|---|---|---|
SWPP-ALL-ALL | traffic inside the application that no detailed rule matched | shows the tiers talk in ways not yet described |
SWPP-ALL-OUT | traffic leaving the application | shows what the application reaches for |
SWPP-ALL-IN | traffic entering the application | shows who reaches into it |
All three are ALLOW with logging. They change nothing about what passes; they exist so their counters can tell how much traffic is still undescribed.
Changing a template renames the existing objects, it does not create a second set: NSX identifiers derive from the prefix and the application name, while the template controls only the display name. The identifier prefix is what marks an object as the GUI's own; it only ever modifies or removes objects carrying it, and leaves rules and groups created by anyone else alone.
Applications
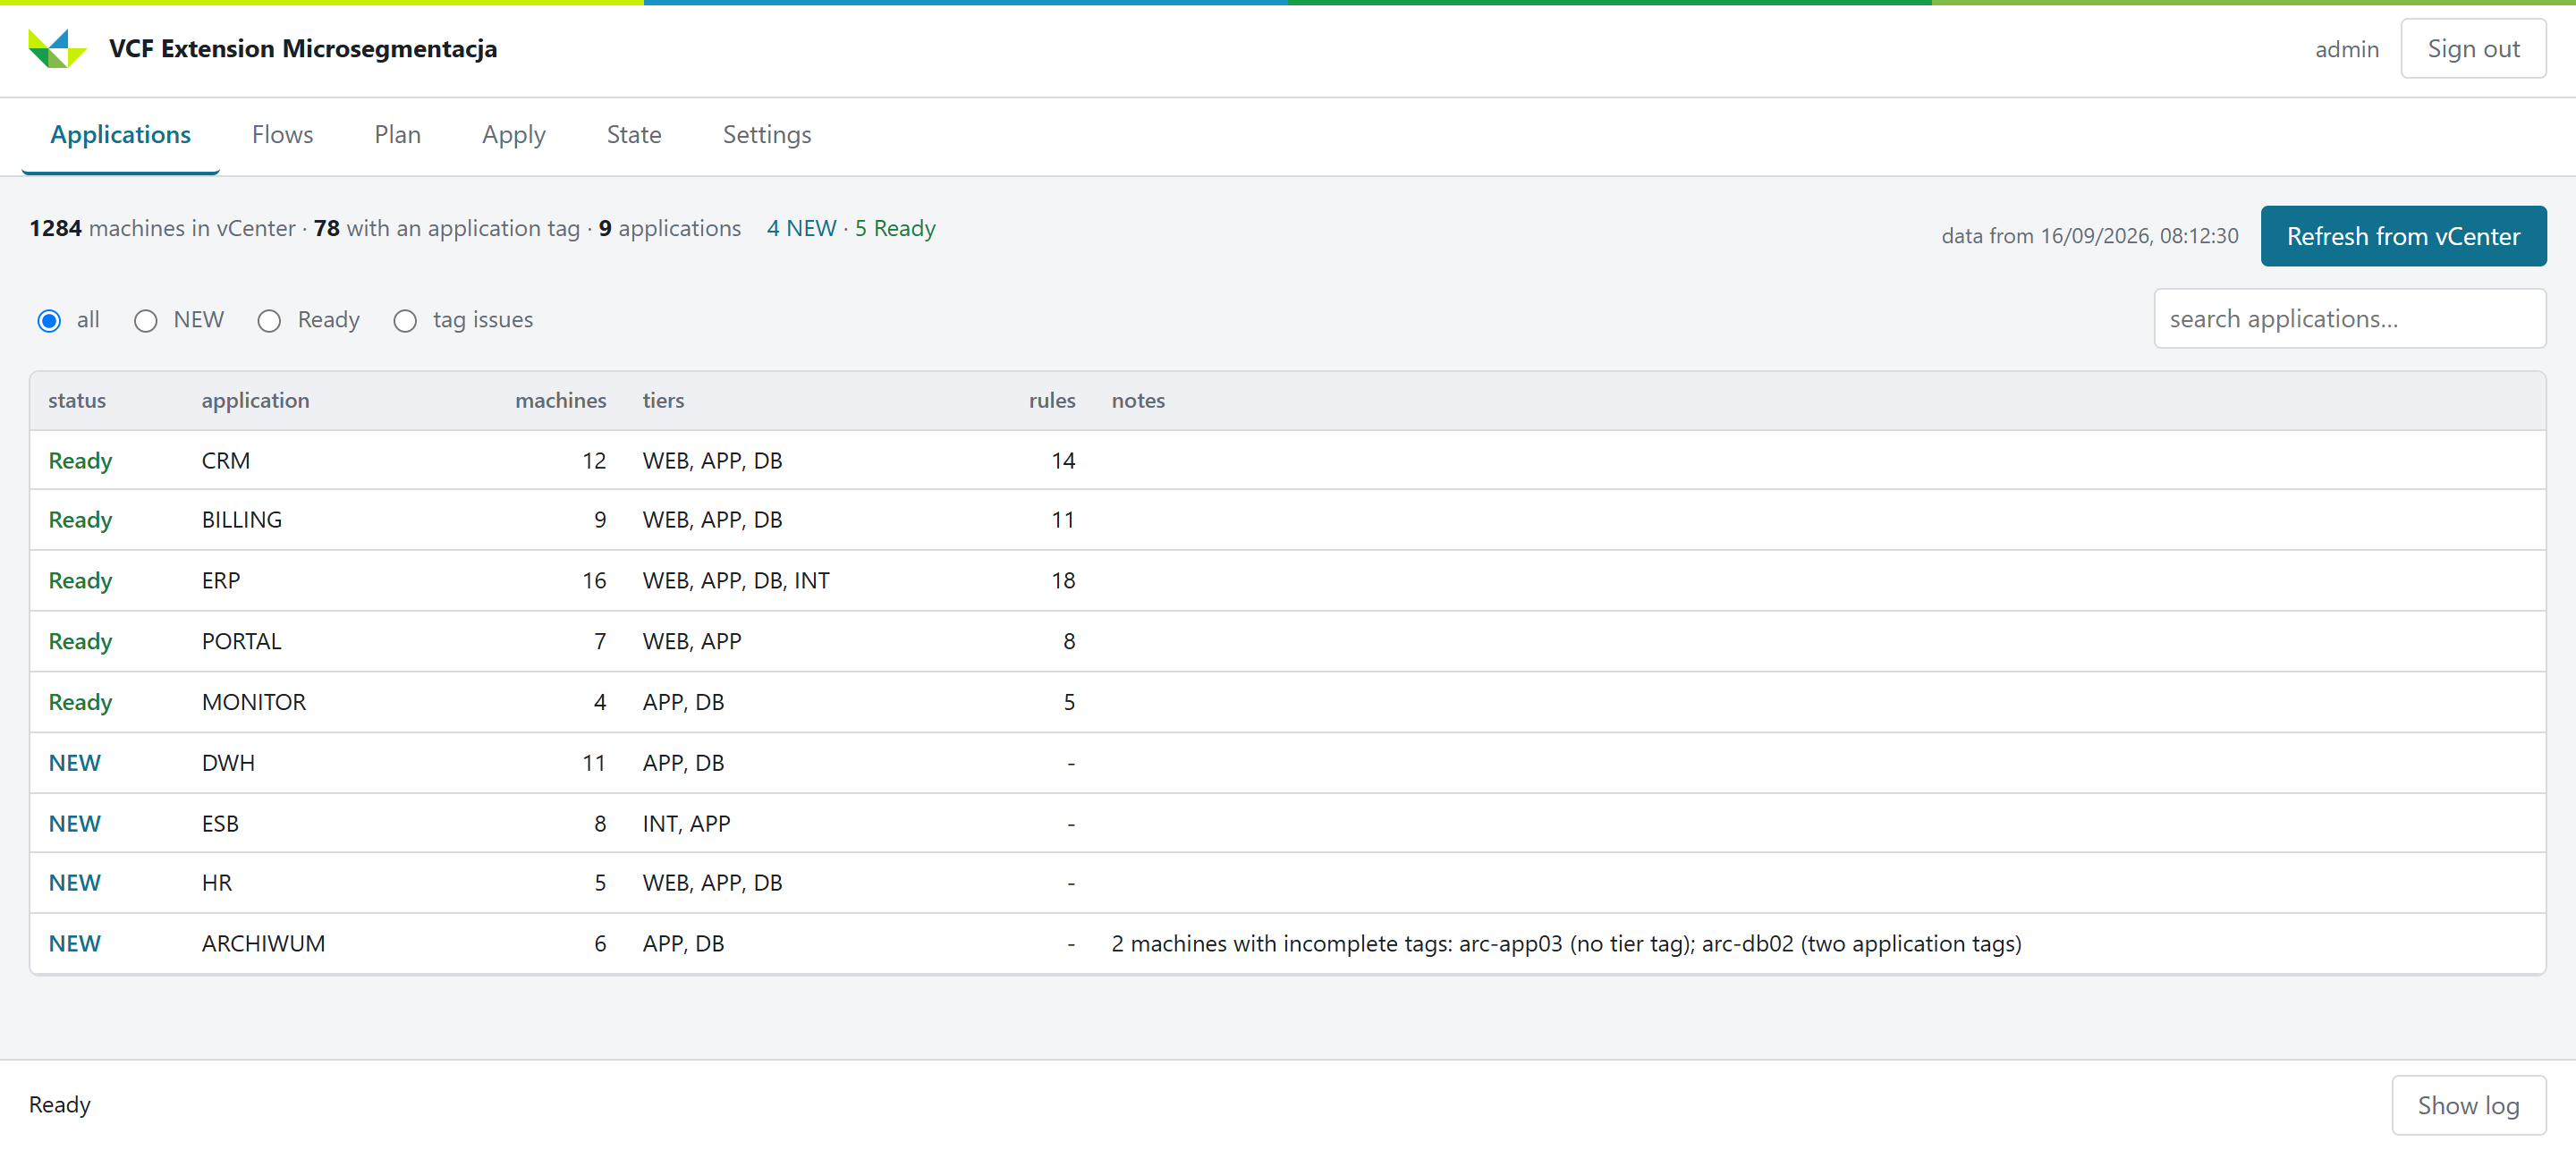
The Applications tab lists every application found in vCenter: how many machines it has, its tiers, how many rules already exist, and any tag problems. An application is either NEW (nothing of ours in NSX yet, or a policy with no detailed rules) or Ready (the policy exists with detailed rules). Machines with incomplete tags are called out here so they can be fixed before segmenting.
Flows
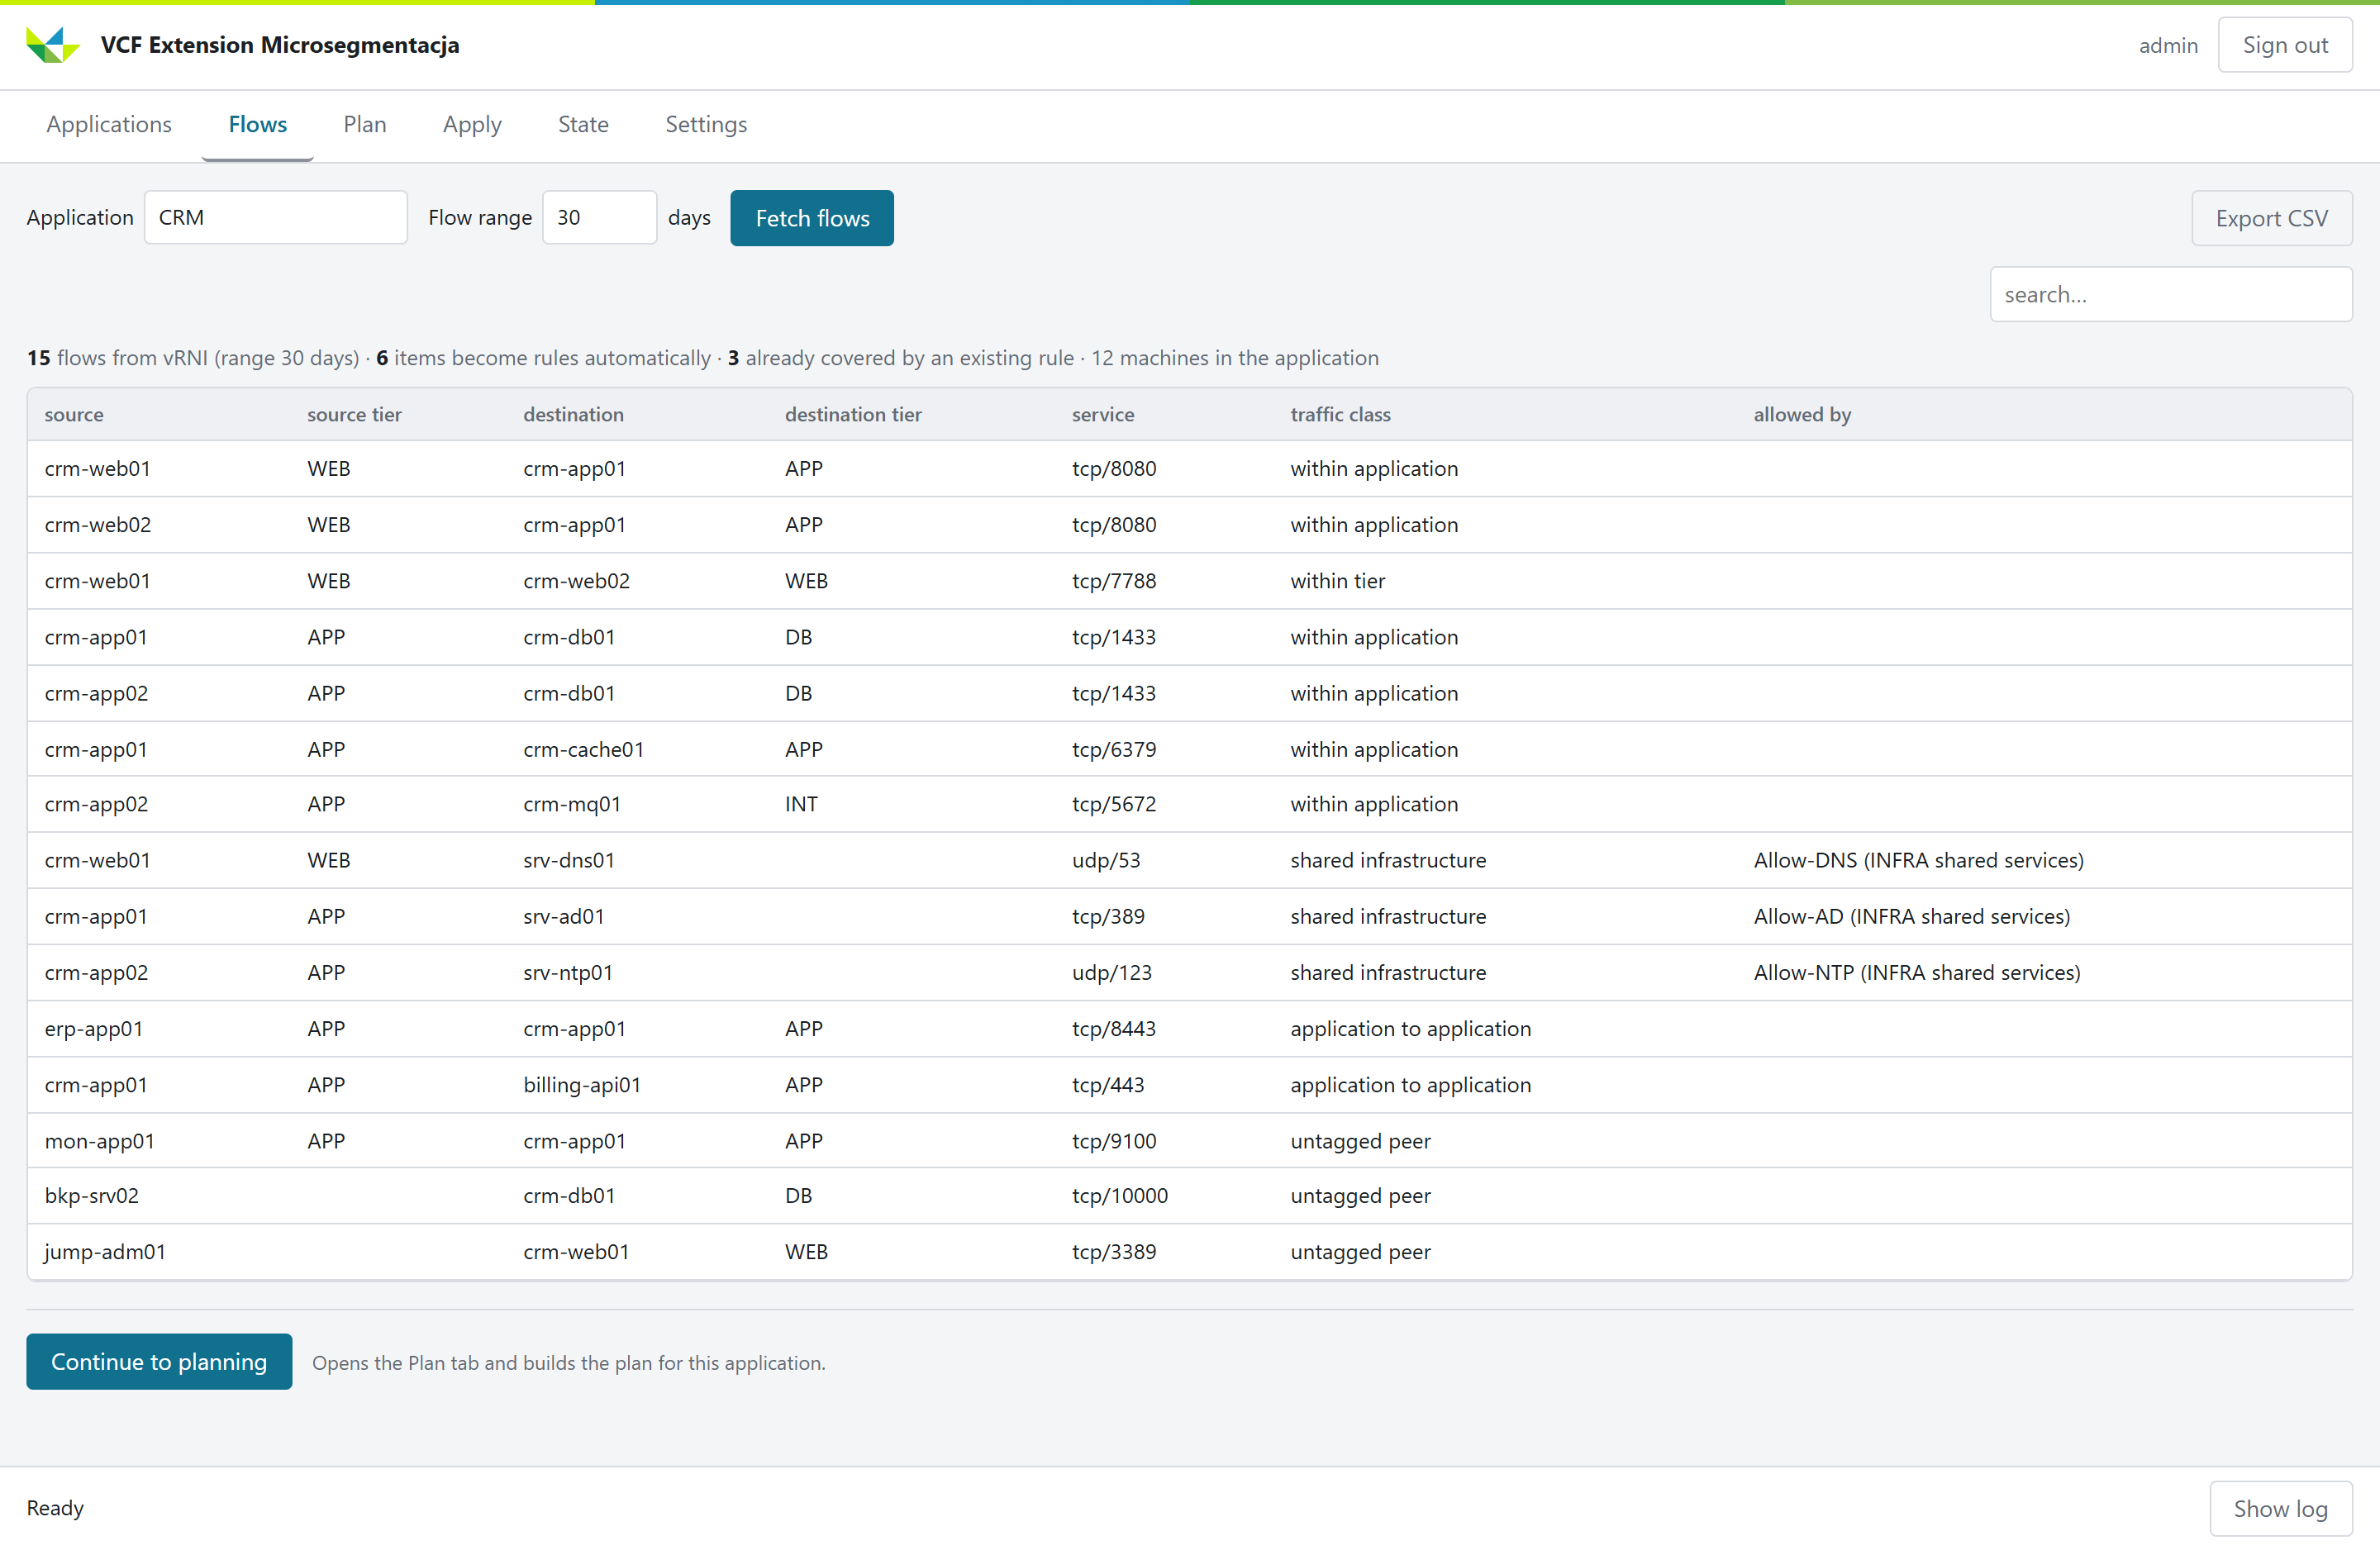
The Flows tab pulls the real traffic for one application from Aria Operations for Networks: source and tier, destination and tier, the service, the traffic class, and which existing rule already allows it. Traffic inside the application becomes rules automatically; traffic to shared services or to other applications is set aside for a decision.
Plan
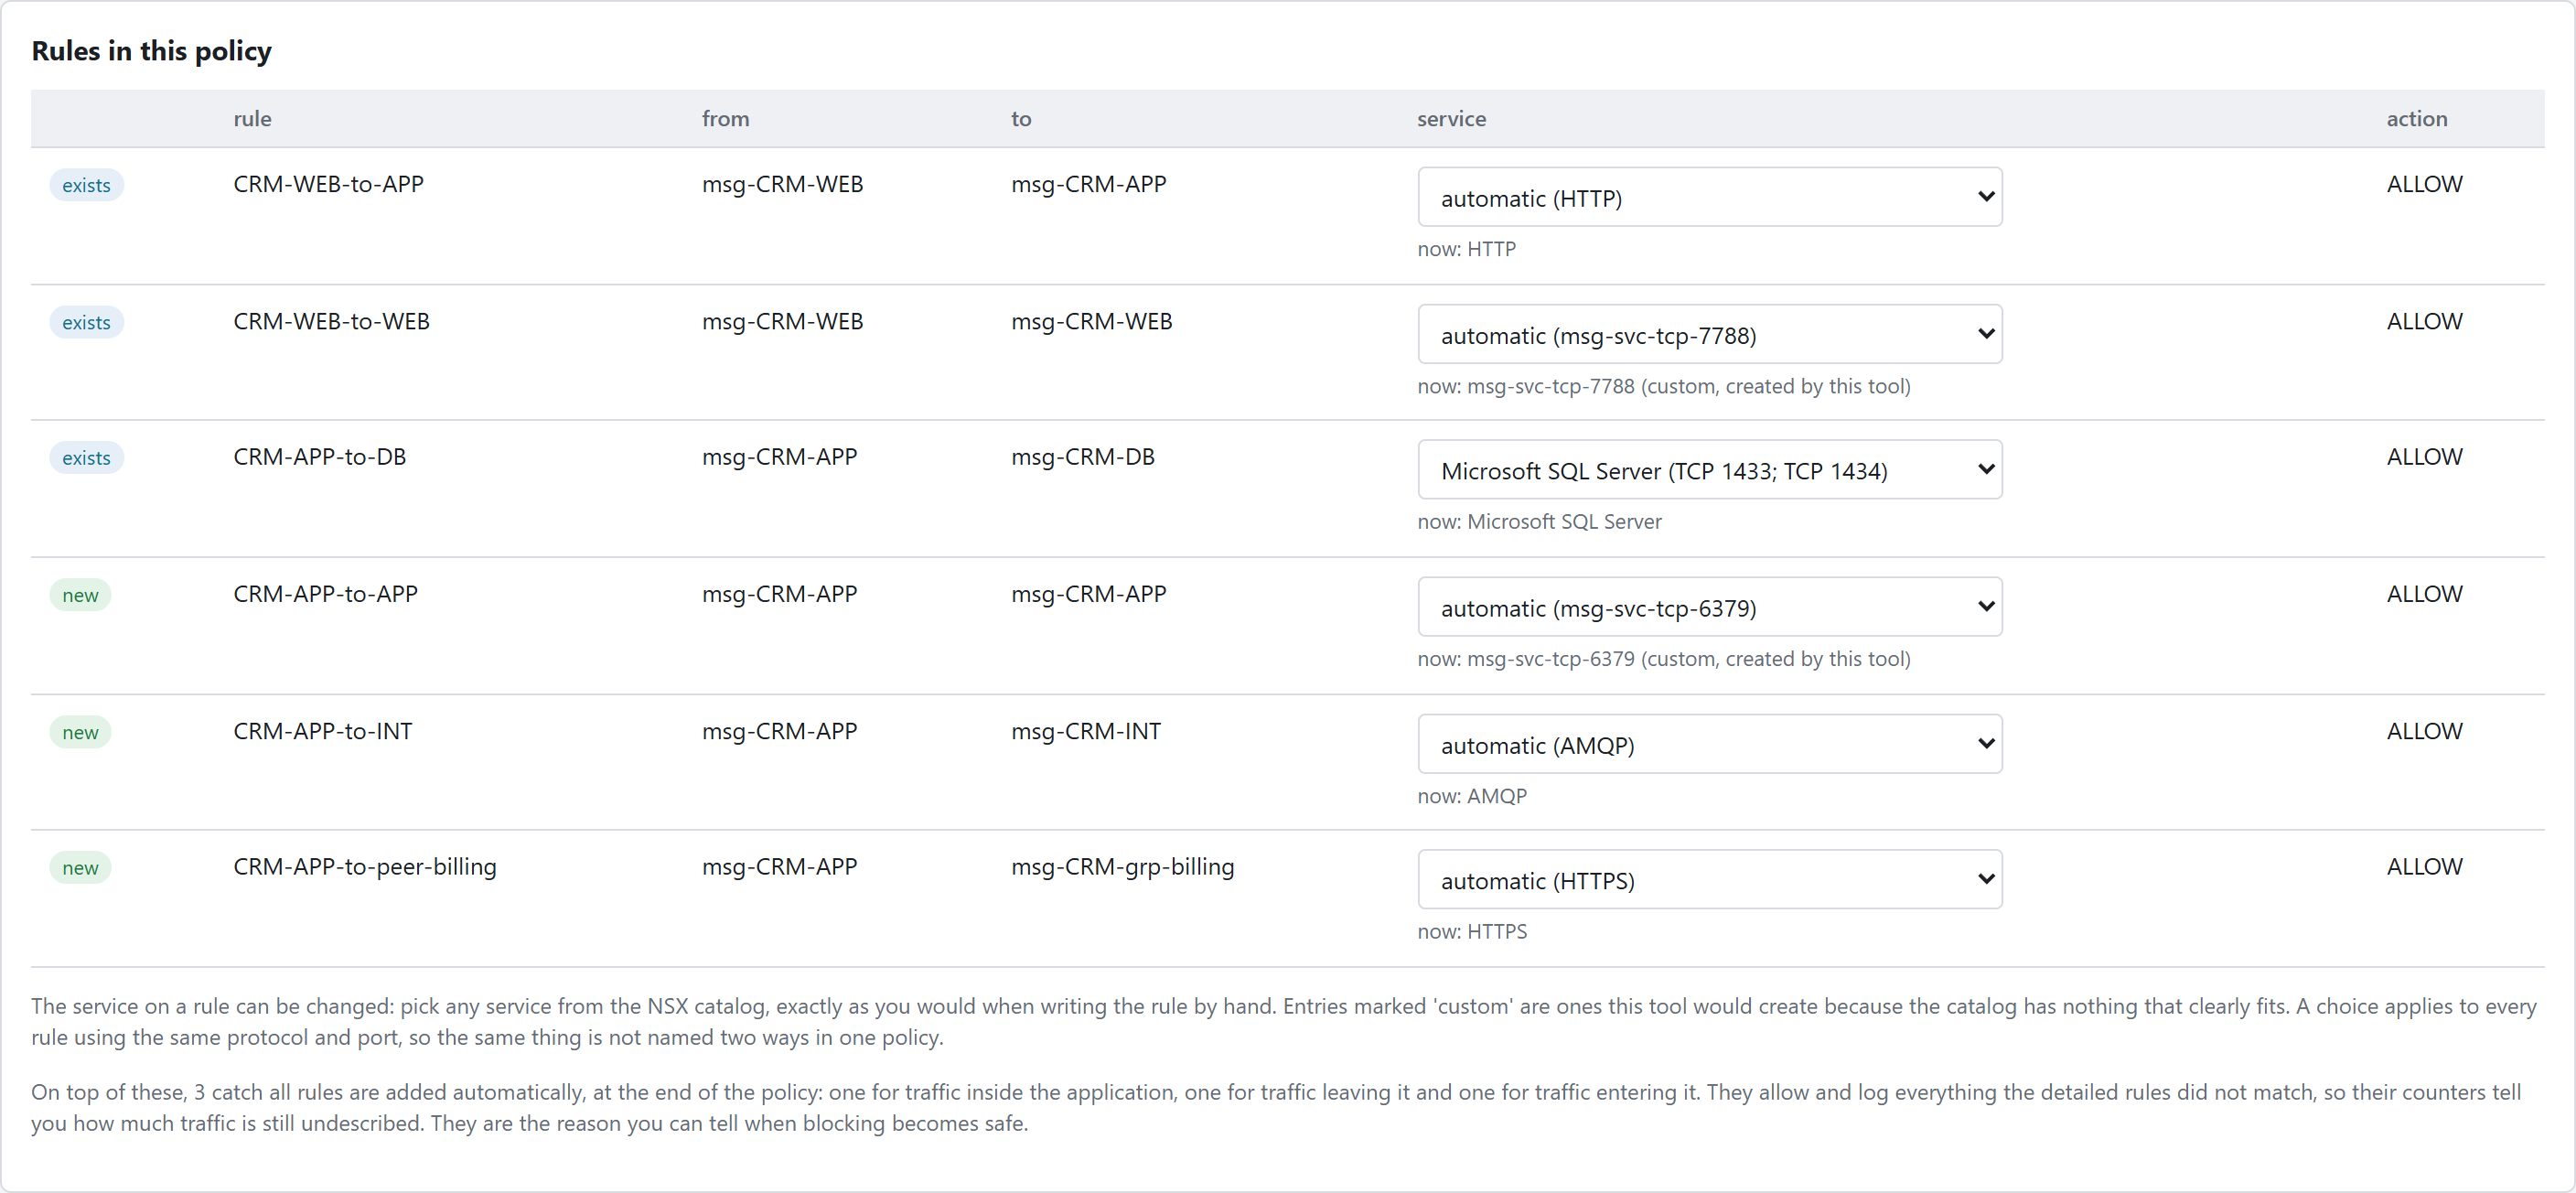
The Plan tab shows the rules that will be in the policy. Each rule marks whether it already exists or is new, and the NSX service on it can be changed: it is chosen from the same NSX service catalog used by hand, and an entry marked "custom" is one the GUI would create because the catalog has nothing that fits. Three catch-all rules are added automatically at the end of the policy, allowing and logging whatever the detailed rules did not match, so their counters show how much traffic is still undescribed.
Traffic the GUI may not decide on its own appears in the same tab as a list with a yes and a no on each row: traffic to another application, to a shared service, or from a machine with no tags. Any number of rows can be settled and saved together.
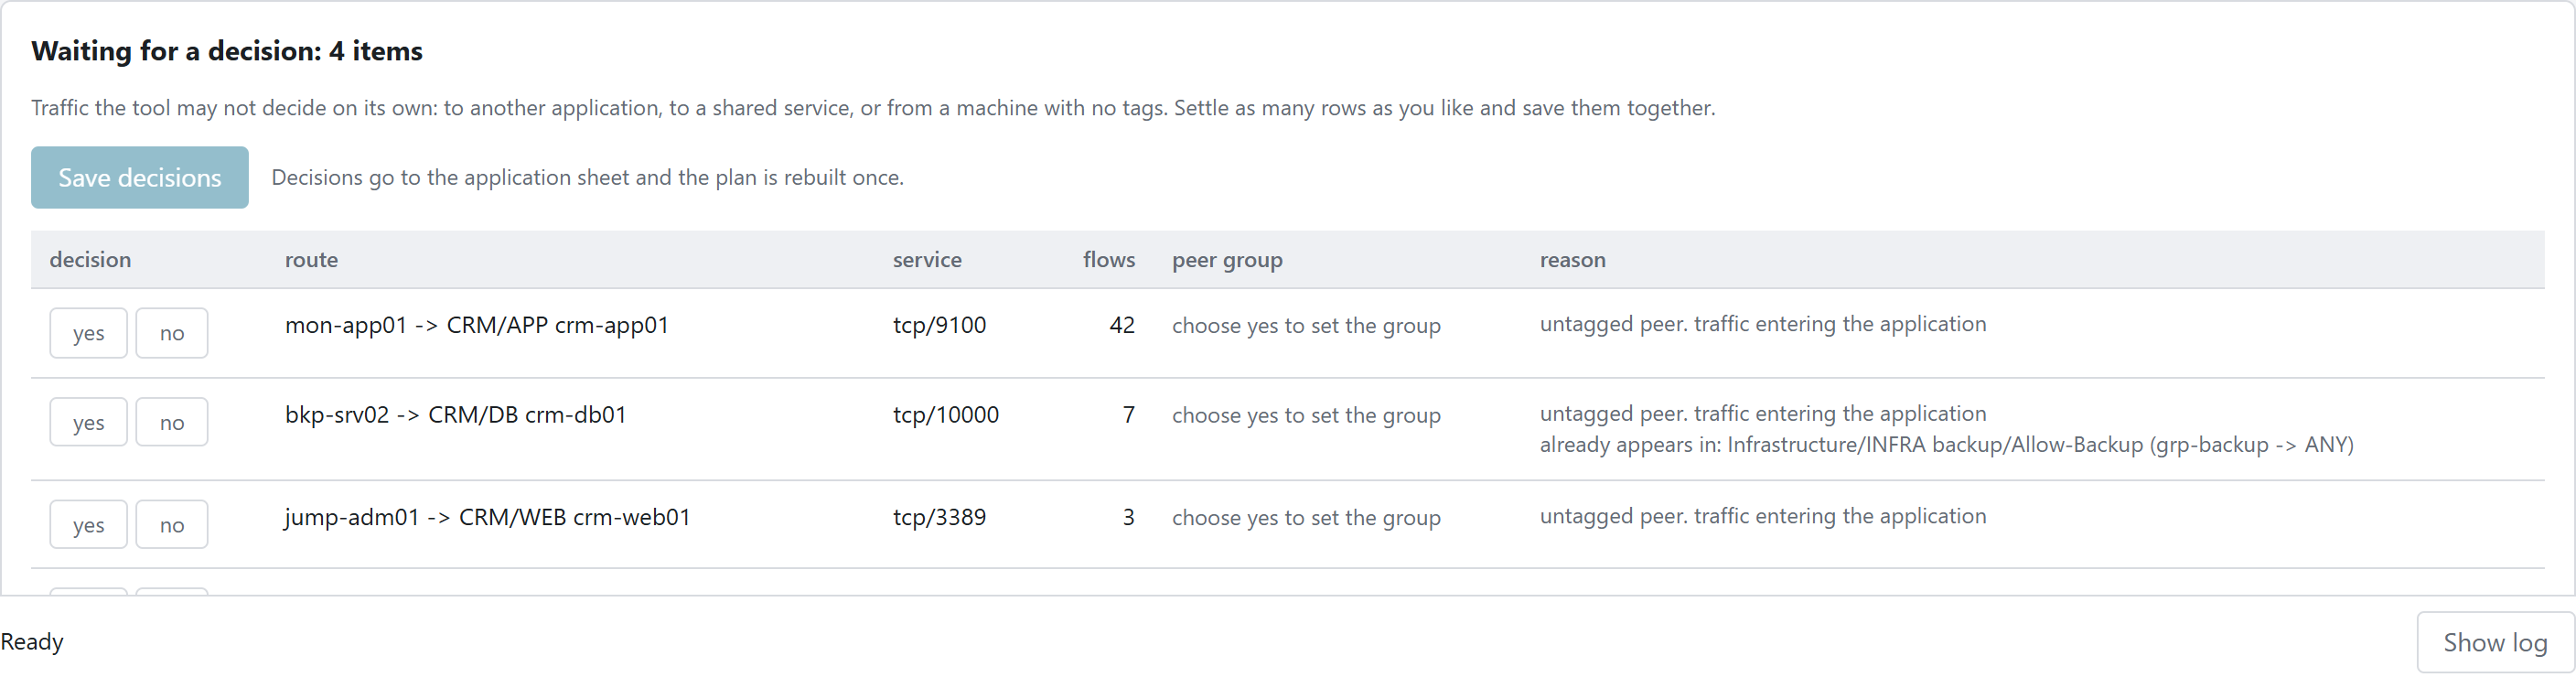
Choosing yes for traffic to a machine outside the application asks what the rule should point at: a new group whose members are named (machine names are suggested from the NSX inventory, and a bare IP address can also be typed; the same group name on several rows gives one group in NSX), or an existing group that already contains that machine (the rule then only refers to it; the GUI does not modify a group it did not create). The approved rows become rules; the ones already handled elsewhere are listed as covered.
Choosing no removes the row from the questions and it does not come back. If the traffic keeps happening, it is reported separately as traffic against a decision. Decisions are stored as a CSV sheet in the data directory, so the record of decisions can be opened in a spreadsheet or reviewed in a merge request.


Choosing the service on a rule
Every rule shows the NSX service it will use, and it can be changed. The list is the NSX service catalog, the same one picked from when writing a rule by hand, with the services matching that protocol and port shown first. The default is automatic: a built-in NSX service is used when its name actually means something for that port, otherwise the GUI creates one of its own, named like msg-svc-tcp-1433. A manual choice wins over that default and applies to every rule that uses the same protocol and port, so the same thing is not named two ways in one policy; setting it back to automatic undoes it.
Apply
The Apply tab writes the plan to NSX: the groups, the rules and the catch-all rules. It stays disabled until a plan has been built, and confirmation requires typing the application name.
State
The State tab reads the live policy back from NSX: the rules with their packet and session counters, and the groups with their members. The catch-all counters are the readiness signal: while they keep rising there is traffic no detailed rule describes, so moving to blocking would break something; when they stop, the application is ready to enforce.
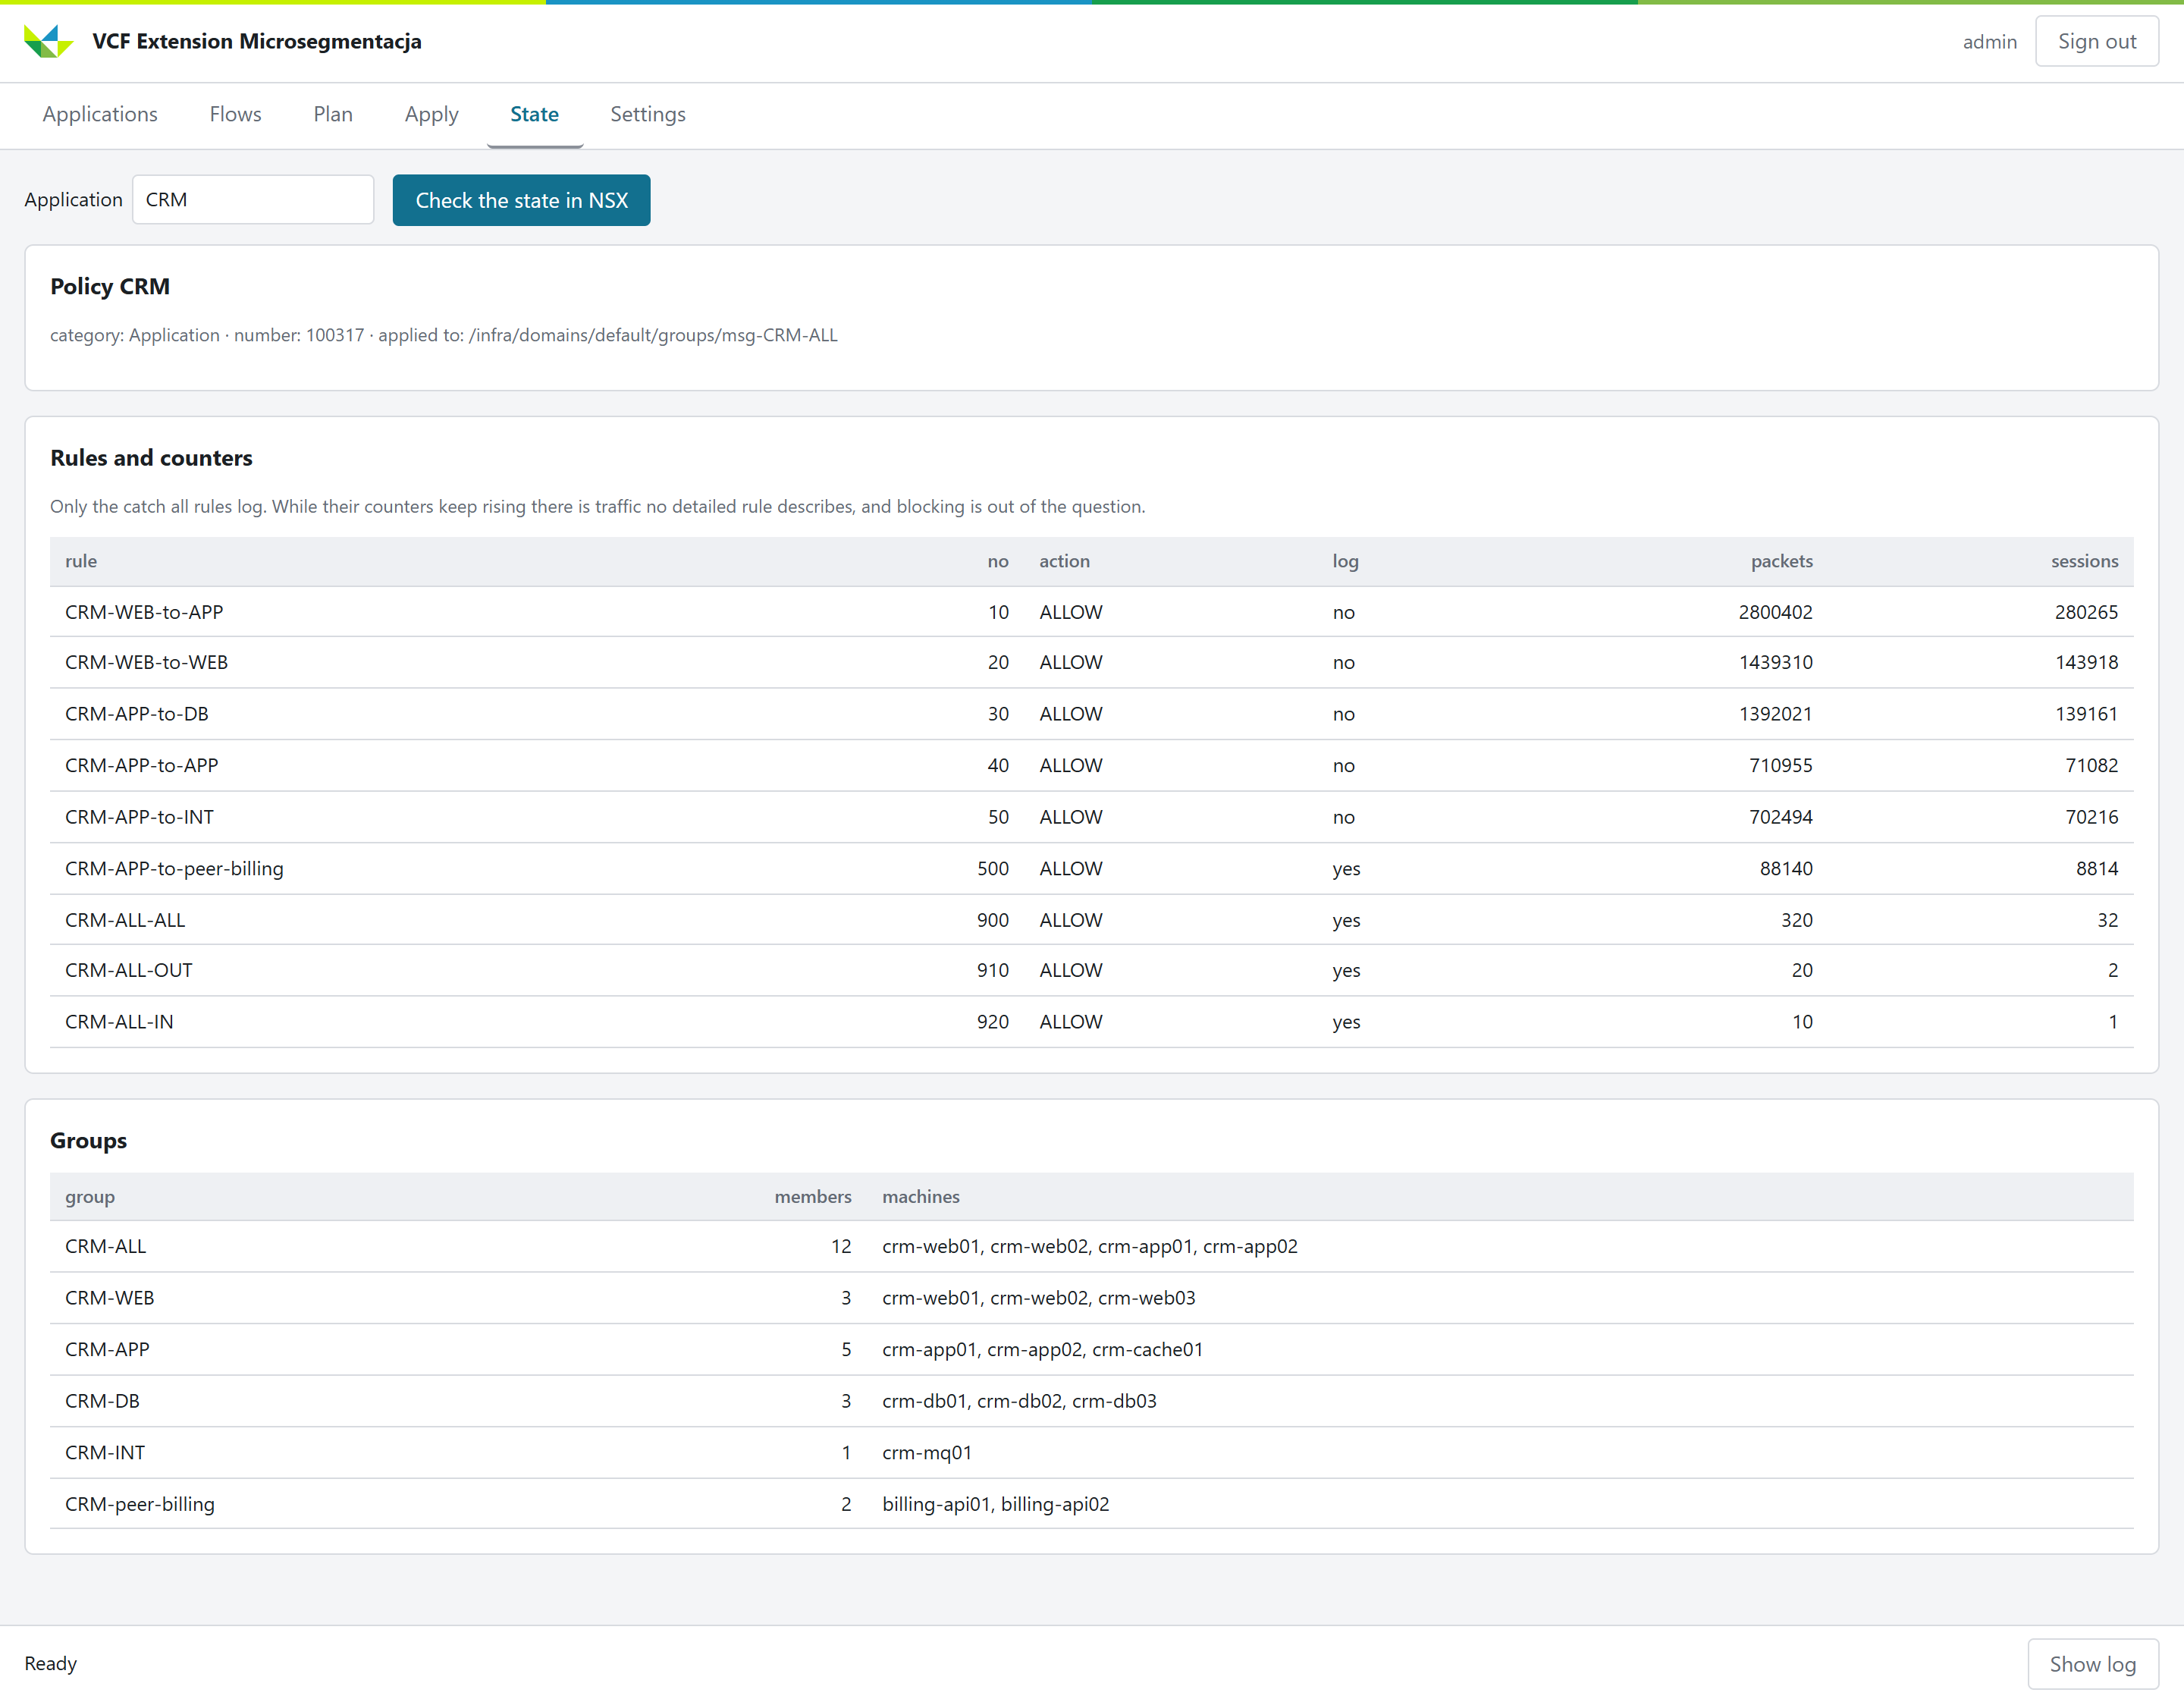
What appears in Aria Operations for Networks
Applying a plan also creates the matching Application in Aria Operations for Networks, with one tier per tier tag and the right machines in each. From then on vRNI shows the application as a whole — its traffic map, tier-to-tier flows and the usual vRNI analytics — without building the application definition by hand and without it drifting from the tags whenever a machine is added. If vRNI is unreachable, the NSX part still works and only this synchronisation is skipped, with a warning in the log.
What the Management Pack adds
Once a policy is in place, the Management Pack picks it up in Aria Operations. It reads the DFW logs through Aria Operations for Logs and attributes every dropped and observed connection to the rule that produced it, so "who is this rule blocking" becomes a fact from the logs rather than a guess from configuration. It builds the same application view from the same tags, gives per-rule traffic and drop counters, and raises alerts on newly blocked traffic. The dashboards, objects and alerts it provides are described in the Overview.
Security
The GUI holds an account with write access to NSX, so the instance is treated like a management machine: on a management network, with access limited to administrators, and a backup of the data directory.
- Passwords for the systems are encrypted in the configuration, with the key stored next to it. Values supplied through the environment take precedence and are never written to the configuration.
- There is one administrator account for the interface; the password is supplied at deployment.
- The container runs as a non-root user with a read-only file system.
- The GUI creates
ALLOWrules only. This is enforced in the code, so no setting can change it.
Troubleshooting
"The configuration is incomplete" on the yellow bar. An address or an account is missing. Open Settings, fill it in and click Test connections.
vRNI returns HTTP 401 with the right password. The user name needs the domain suffix: admin@local, not admin.
Aria Operations for Logs returns an error that looks like a wrong password. The query API answers on port 9543 only. Enter the address alone and the port is added.
The application list is empty after a restart. The inventory lives in process memory, so a restart clears it. Click Refresh from vCenter.
An application shows no traffic although traffic exists. The GUI asks vRNI about the addresses of the machines from its own inventory. Check on the Flows tab how many addresses were found and whether those are the addresses the traffic actually uses; after an environment is rebuilt, vRNI can keep a historical mapping of a machine name to an old address.
A machine ends up in the on-hold section. Its tags are incomplete or doubled. The Applications tab shows what is missing. A machine with an incomplete description is never skipped quietly.
Flow range. vRNI retention is usually 31 days, and asking for a larger range ends with HTTP 400. With no range given, vRNI returns only the last day, which for a process run once a month misses most of its traffic.